The fnAddLabel is used to add a label to a price chart.
After the fnGetTrendLineValue function has been added to a Drawing, it is configured by clicking the (+) button along the bottom of the Element.
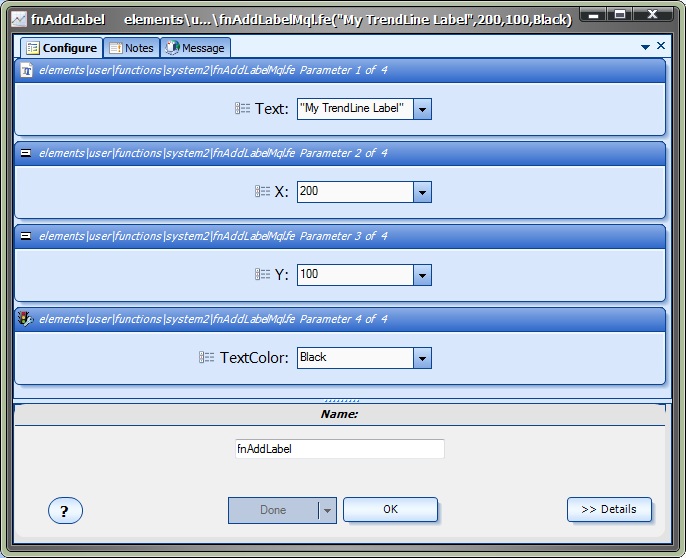
The Function Configuration window allows you to select values for each parameter.
Parameter Name |
Data type |
Description |
Text |
string |
The text of the label to add to the price chart. The text must be surrounded by double quotes, for example "myName". |
X |
integer |
The horizontal offset from the top left corner of the chart. The X value is zero at the far left corner of the chart and increases as you move to the right. The default value is 200. |
Y |
integer |
The vertical offset from the top left corner of the chart. The Y value is zero at the top of the chart and increases as you move down. The default value is 100. |
TextColor |
Color |
The color of the text. |