The function fnDrawPivotPoints is used to programatically draw a Pivot Point, as a horizontal line, on a price chart.
After the fnDrawPivotPoints function has been added to a Drawing, it is configured by clicking the (+) button along the bottom of the Element.
The Function Configuration window allows you to select values for each parameter.
The definition of the pivot point calculations are:
Pivot Point = (Previous High + Previous Low + Previous Close) / 3
The pivot point can then be used to determine levels of estimated support and resistance levels for the day:
- Resistance Level 1 = (2 * Pivot Point) - Previous Low
- Support Level 1 = (2 * Pivot Point) - Previous High
- Resistance Level 2 = (Pivot Point - Support Level 1) + Resistance Level 1
- Support Level 2 = Pivot Point - (Resistance Level 1 - Support Level 1)
- Resistance Level 3 = (Pivot Point - Support Level 2) + Resistance Level 2
- Support Level 3 = Pivot Point - (Resistance Level 2 - Support Level 2)
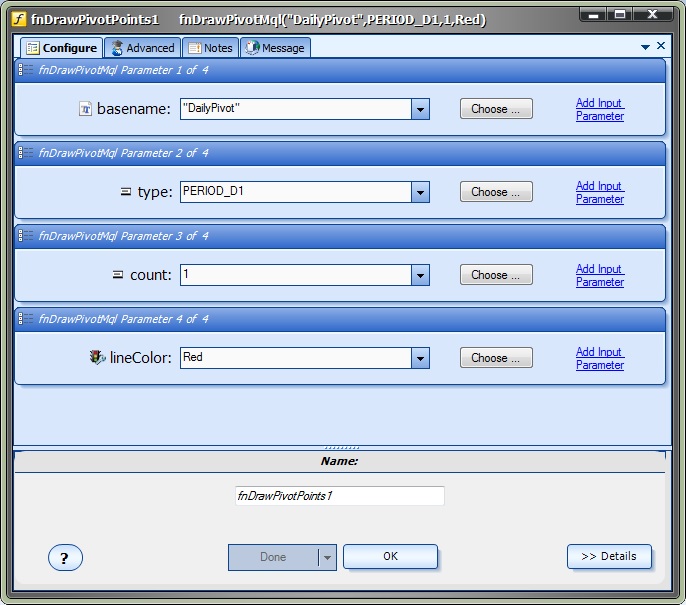
These parameters appear on the main configure tab:
Parameter Name |
Data type |
Description |
basename |
string |
The basename of line objects that are drawn on the price chart. The basename is combined with the bar number, shift and line type to create a unique name for each line that is drawn on the chart. |
type |
timeframe |
The timeframe of the pivot point. Any timeframe can be used, but Daily, Weekly and Monthly and most popular. On a 1 hour price chart, a Daily pivot point line will be drawn across 24 candles. |
count |
count |
This controls how many lines are drawn. For a Daily pivot point, a count = 1 will draw a line representing today's pivot point. A count = 2 will draw today's and yesterday's pivot points. |
lineColor |
color |
The color of the line/s. |
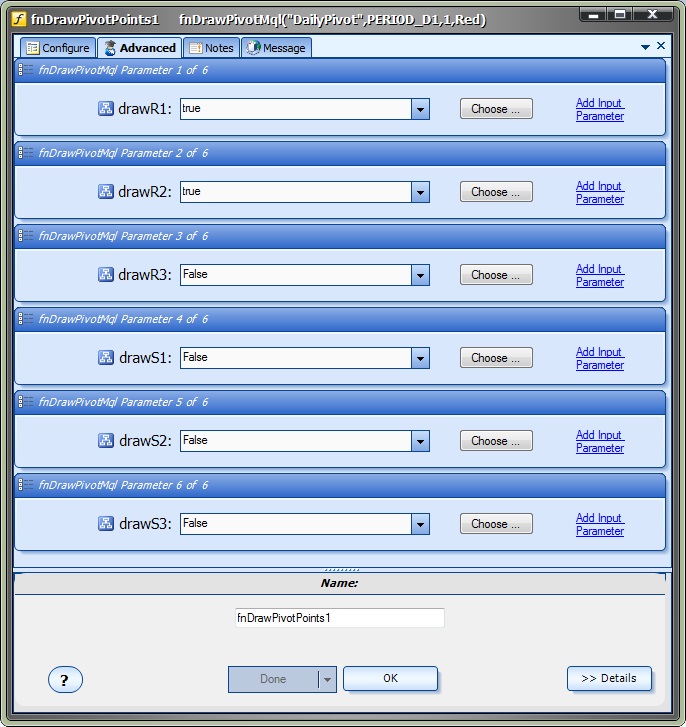
These parameters appear on the advanced tab
Note: In order to capture the values of any of the support or resistance lines using the function fnGetPivotLevel, the lines must be drawn using the fnDrawPivotPoints function.
These values are used to draw the support or resistance lines:
Parameter Name |
Data type |
Description |
drawR1 |
Boolean |
If true, the Resistance Level 1 line is drawn on the chart. |
drawR2 |
Boolean |
If true, the Resistance Level 2 line is drawn on the chart. |
drawR3 |
Boolean |
If true, the Resistance Level 3 line is drawn on the chart. |
drawS1 |
Boolean |
If true, the Support Level 1 line is drawn on the chart. |
drawS2 |
Boolean |
If true, the Support Level 2 line is drawn on the chart. |
drawS3 |
Boolean |
If true, the Support Level 3 line is drawn on the chart. |
Note: It is possible that not all of the support or resistance lines will be shown on the price chart. If the value of the line is too large or too small it may not appear on the price chart depending on the scale and timeframe of the chart.
The main configure tab:
The advanced tab, used for drawing support and resistance lines: