Q:
Can the EA advisor create indicators ?
If I wanted in an indicator window to show vertical lines :
Green when Trend is positive and Red when Trend is Negative.
Positive Trend is when 8 ma is above 20 ma and Negative Trend is when 8 ma is below 20 ma.
A:
No, not really. VTS offers a plug-in to create an indicator from any VTS system. It creates a simple indicator that plots a number between -1 (sell) to +1 (buy) based on the EA’s trade signal. (http://www.iexpertadvisor.com/ea-indicator-plug-in/)
To create an indicator, after the plug-in is installed, at the top of VTS, select “EA Indicator” and click the Build button:

But that won’t help with your request.
I’ve held off on creating an Indicator Builder because I can’t find a way to make it easy to build a non-trivial MQL custom indicator using a builder. MQL custom indicators are pretty complicated, they always requires loops, and they can be very diffcult to debug (when they do not redraw properly). Until I can create a tool that I would use, I will not sell an Indicator builder. Actually, when you create a new indicator using the MetaTrader editor MetaEditor, it takes you through a mini-wizard that is not that bad. That may be as easy as it can get.(Still, I love a challenge, so I am always looking for a way to make building custom indicators easy, I’m just not hopeful).
However, you could build an EA to “almost” do what you described above. The reason I say almost, is because the solution I am proposing would draw the vertical lines on the price chart, not in an “indicator window”.
Anyway, you could use the Chart Object plug-in to implement this pretty easily. (http://www.iexpertadvisor.com/mt4-chart-objects-plug-in/)
Here is the drawing (the configuration of each element is shown below):
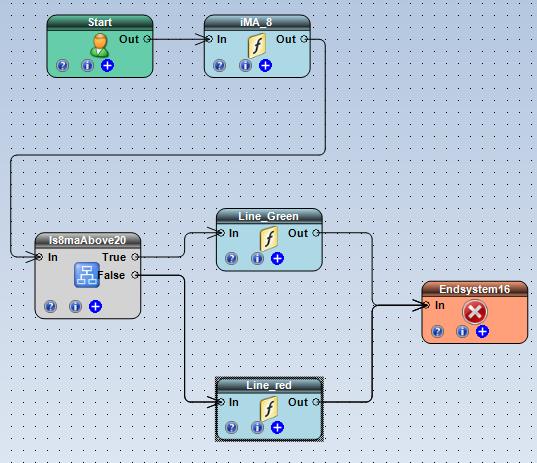
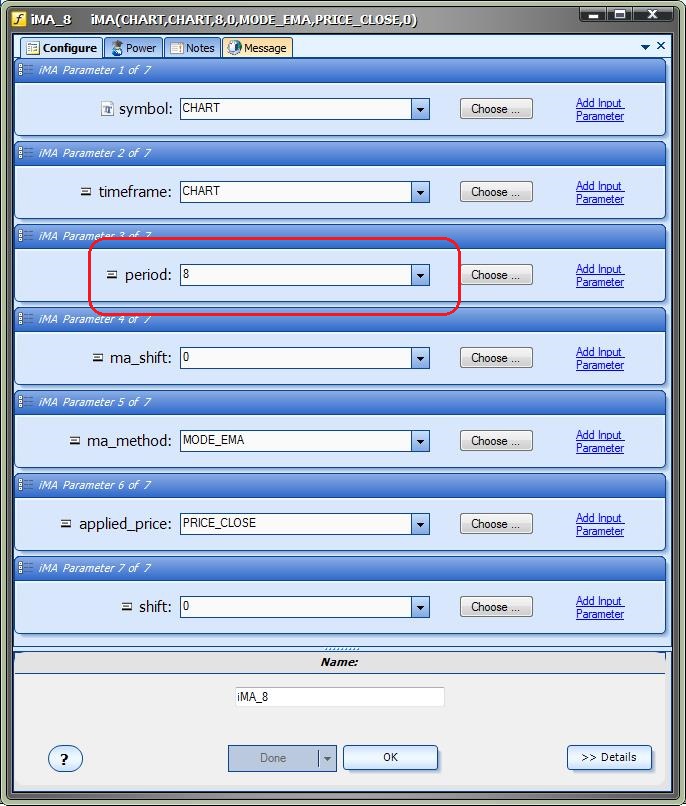
The 8-period Moving Average (From the Functions Toolbox, Indicators->iMA)
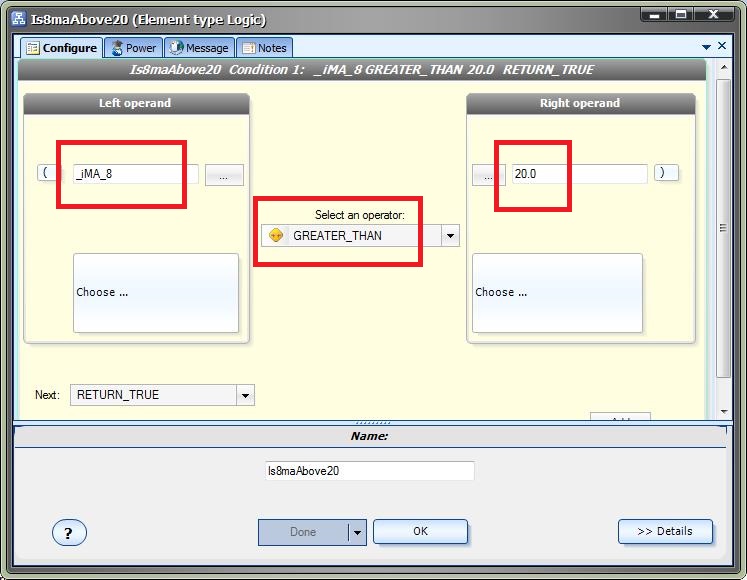
The Logical condition:
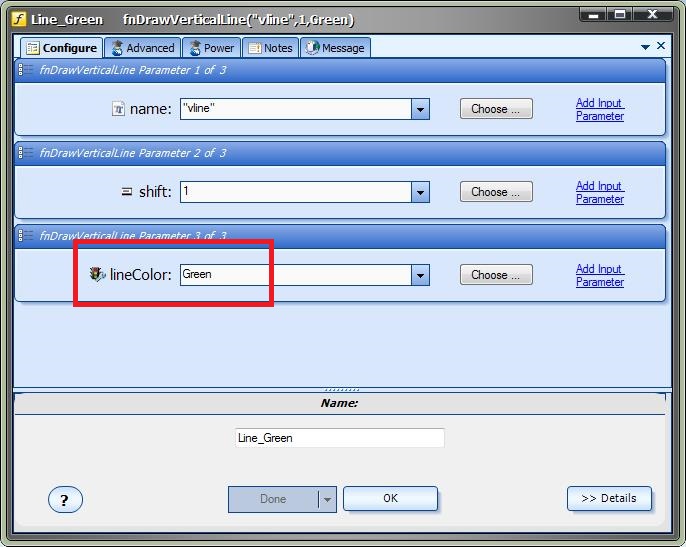
The Green line (From the Functions Toolbox, ChartObjects->fnDrawVerticalLine):
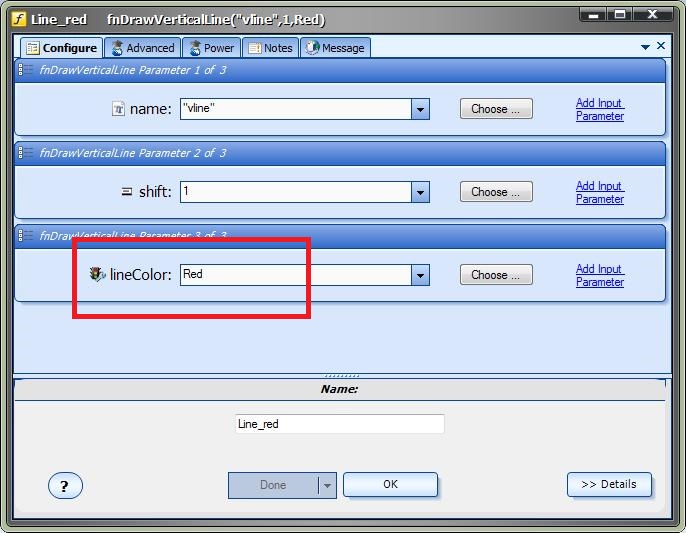
The Red line (From the Functions Toolbox, ChartObjects->fnDrawVerticalLine):
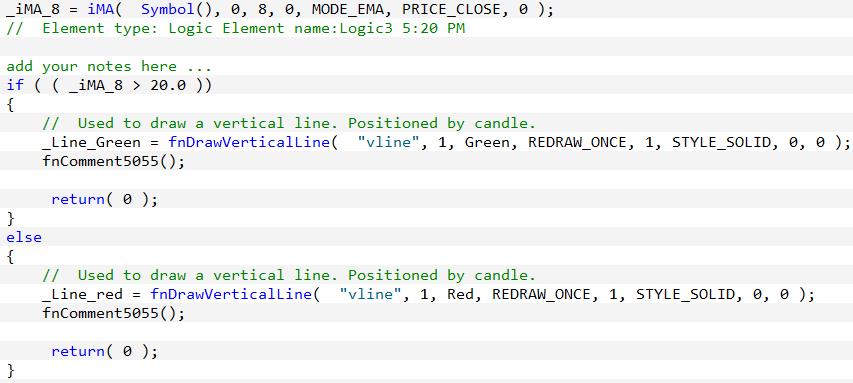
Finally, a section of the generated MQL code:
To be notified about the latest questions and answers, follow us on Twitter