Other News

Indicator Creator


Q:

Can the EA advisor create indicators ?

If I wanted in an indicator window to show vertical lines :

Green when Trend is positive and Red when Trend is Negative.

Positive Trend is when 8 ma is above 20 ma and Negative Trend is when 8 ma is below 20 ma.


A:

No, not really.  VTS offers a plug-in to create an indicator from any VTS system.  It creates a simple indicator that plots a number between -1 (sell) to +1 (buy) based on the EA’s trade signal. (http://www.iexpertadvisor.com/ea-indicator-plug-in/

To create an indicator, after the plug-in is installed, at the top of VTS, select “EA Indicator” and click the Build button:


But that won’t help with your request.


I’ve held off on creating an Indicator Builder because I can’t find a way to make it easy to build a non-trivial MQL custom indicator using a builder.  MQL custom indicators are pretty complicated, they always requires loops, and they can be very diffcult to debug (when they do not redraw properly).  Until I can create a tool that I would use, I will not sell an Indicator builder.  Actually, when you create a new indicator using the MetaTrader editor MetaEditor, it takes you through a mini-wizard that is not that bad. That may be as easy as it can get.(Still, I love a challenge, so  I am always looking for a way to make building custom indicators easy, I’m just not hopeful).


However, you could build an EA to “almost” do what you described above.  The reason I say almost, is because the solution I am proposing would draw the vertical lines on the price chart, not in an “indicator window”.


Anyway, you could use the Chart Object plug-in to implement this pretty easily. (http://www.iexpertadvisor.com/mt4-chart-objects-plug-in/)


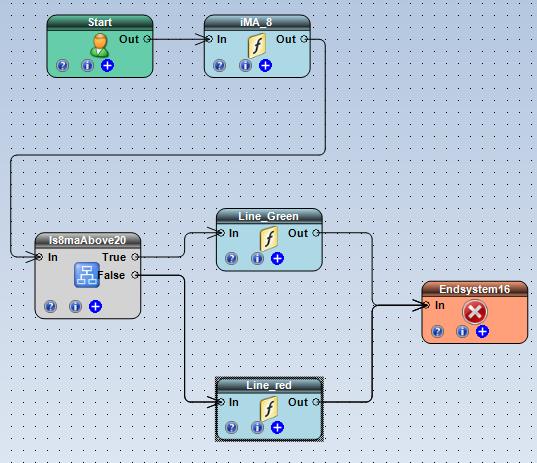
Here is the drawing (the configuration of each element is shown below):


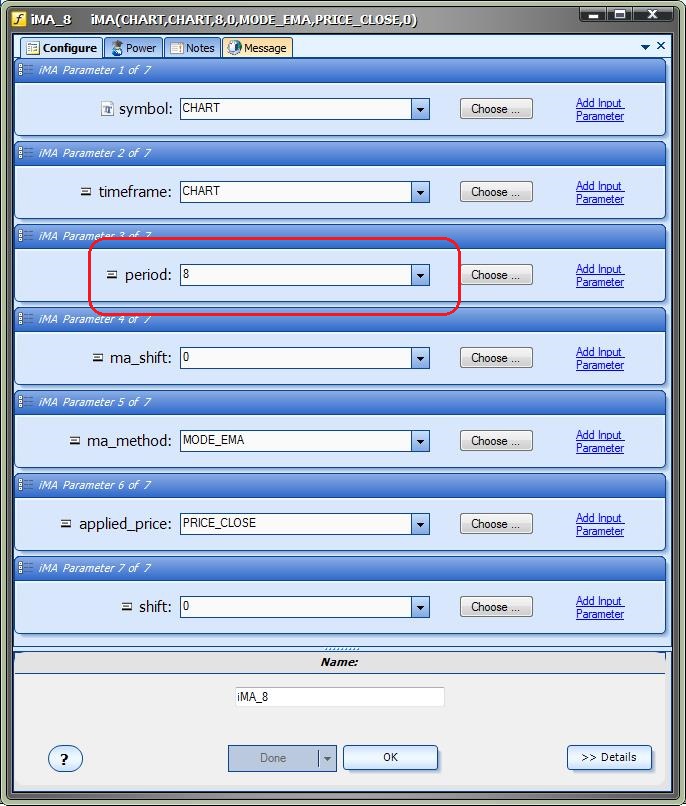
 The 8-period Moving Average (From the Functions Toolbox, Indicators->iMA)


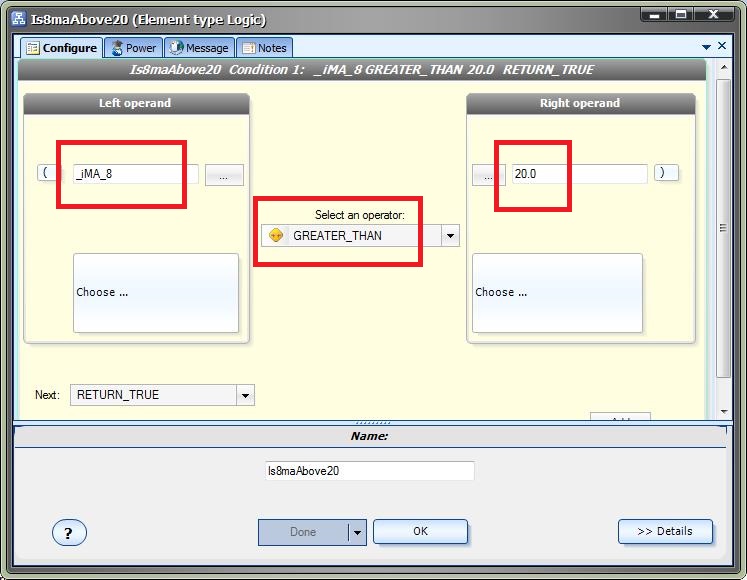
 The Logical condition:


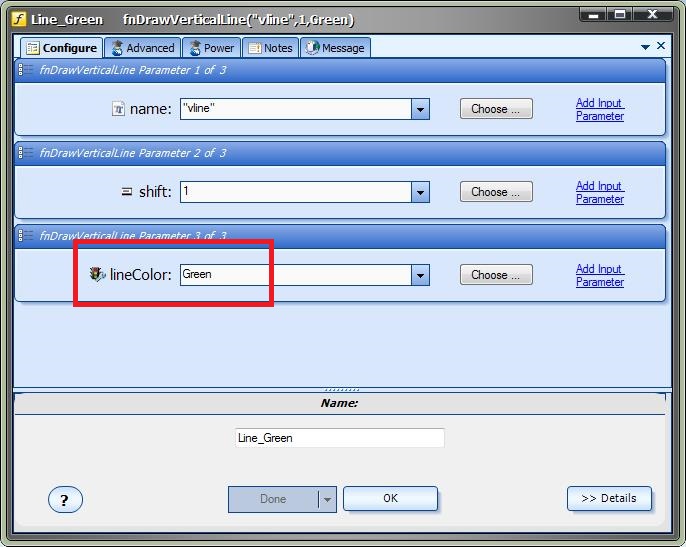
The Green line (From the Functions Toolbox, ChartObjects->fnDrawVerticalLine):


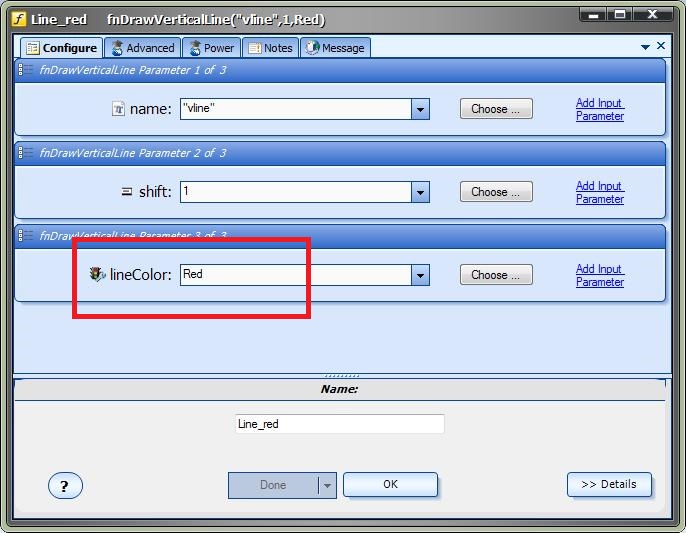
The Red line (From the Functions Toolbox, ChartObjects->fnDrawVerticalLine):


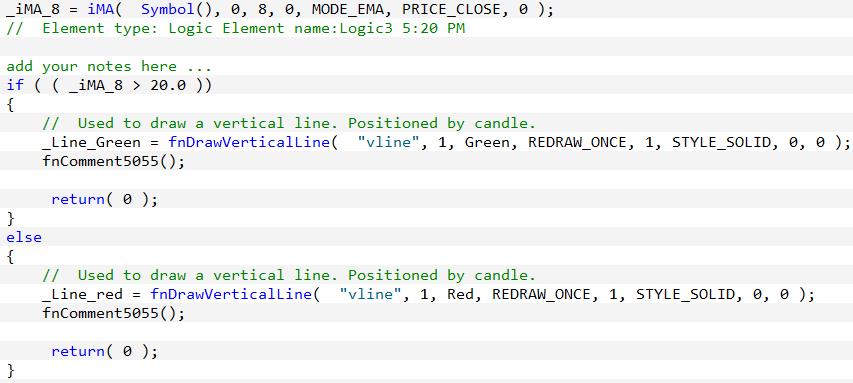
 Finally, a section of the generated MQL code:


To be notified about the latest questions and answers, follow us on Twitter


RAQ

Heiken Ashi

Q:


Is it possible to use the Heiken-Ashi chart as additional filter? How I can setup, that a buy signal is only true, if the Heiken-Ashi color is green ( up) and sell when Heiken-Ashi is red (down)?


A:


Heiken-Ashi  is a custom indicator and it can be used by VTS if it is configured properly. See the VTS Help for instructions:


http://asp.iexpertadvisor.com/asp/help/html/index.html?customindicators.html


Also, VTS supports a Custom Indicator Indicator (CIA) wizard from the VTS welcome page. This wizard builds an EA that allows you to understand the input and output of any custom indicator.  Once you understand the custom indicator, you should be able to configure it fairly easily. The wizard offers step-by-step instructions and much knowledge about MQL custom indicators.


Some custom indicators  are very easy to incorporate into an EA – others are not. Among the most difficult is tasks is determining when a single line has changed color. The CIA wizard should be enough to guide you, however we have a VTS system that uses a custom indicator that changes color and a video is provided that shows exactly how the custom indicator is configured. You read more here: http://www.iexpertadvisor.com/hull-ma-expert-advisor-trading-system/


To be notified about the latest questions and answers, follow us on Twitter


RAQ