Candlestick Drawing
The Candlestick functions were created as Drawing functions.
To open the drawing of any Candlestick function, drag the function from the Toolbox onto the Drawing Pad and double-click the Element in the caption area.
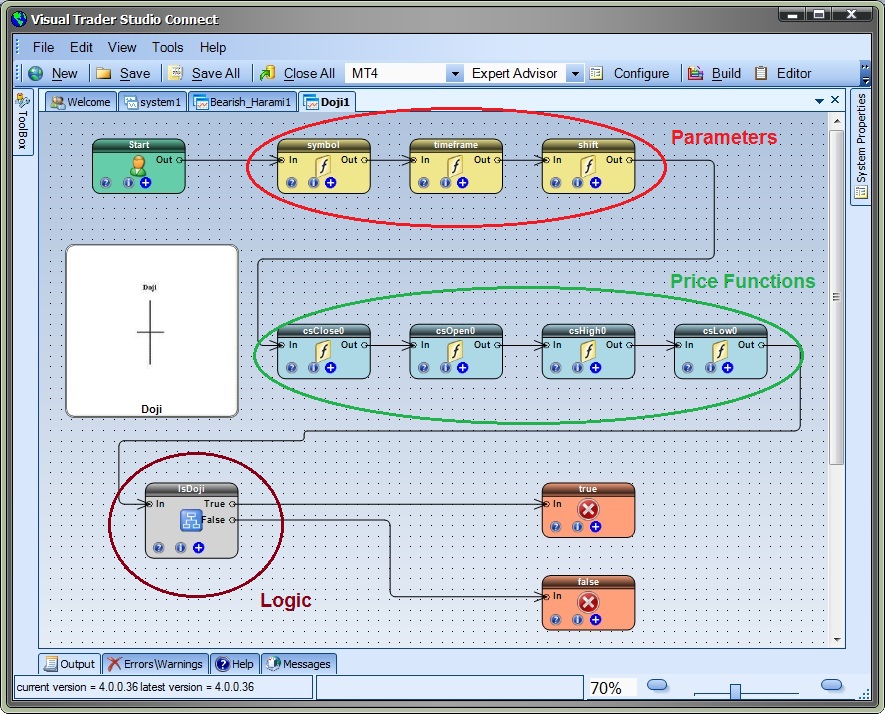
Each candlestick drawing contains the same Elements:
- One Start Element
- 3- 5 Variable Elements defined with a scope of Parameter
- 4-N MetaTrader price functions, such as iClose, iOpen, iHigh and iLow
- One Logic Element
- Two End Elements, one for True and one for False
- An image of the Candlestick pattern (for reference only, the image is not connected to any Elements)
The first row of Elements contains the Parameter Variables. These are the values that appear when you select the (+) button on the Candlestick function Element. These values are referenced through the rest of the drawing. For example, the Symbol and Timeframe values are used in the Price functions.
The second row of Elements contains the price functions that are used in the Logic Element to identify the candlestick pattern. The number of price functions will vary depending on the pattern. In general, the open, close, high and low price values will be need for a number of different candles consecutive candles, where the index of the candle is determined by the shift value.
The Logic Element is connected after the price functions. The Logic Element will contain many logical conditions. These conditions represent the definition of the candle pattern. For example, a Bear candle is defined as a candle that closed lower than it opened. (A bear candle is usually colored black or red on a price chart). This definition is logically expressed as Close < Open (The Close is less-then the open). The conditions with the logic will use price values that already considered the Symbol, Timeframe and Shift.
The drawing terminates with a True or False Element. If the Logic Element resolves to True, meaning the pattern has been recognized, then the drawing will terminate with a value of True. Otherwise the drawing will terminate with a value of False.
Note: Candlestick patterns that use the phrase long or short define two additional Parameters and two MQL Elements to calculate the values of long or short named getlongbody and getshortbody, respectively. The MQL Elements are found on the first line, connected after the parameter Elements.